Page 1 of 1
[Solved] Find multiple peaks in (X,Y) data
Posted: Wed Feb 21, 2024 3:19 am
by Greg Holmberg
How can I find the several peaks in my x,y data?
I have two columns of numbers, x and y, and 5000 rows of these. x steps by 0.1 (60.0, 60.1, 60.2, etc). y is a calculated number, for example -76.095370.
The values look like this:
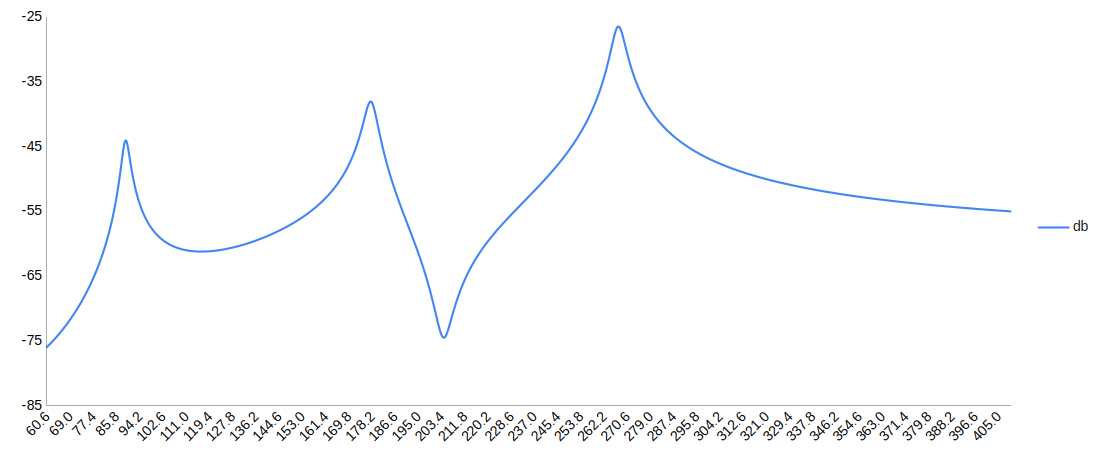
- freq-db.png (44.96 KiB) Viewed 2378 times
(That's frequency vs. sound pressure decibels modeled for an acoustic guitar, in case anyone cares.)
You can see three peaks. I want to know the x,y values for each of these peaks, and place them in six cells somewhere. I don't want to search for them manually, it takes too long.
I don't see a way to do this with the MAX() function. GNU Octave has findpeaks(), but I don't see anything like this in Calc. Is there something else?
I'm running OpenOffice 7.6.4.1 on Ubuntu 23.10 on Intel.
Thanks,
Greg
Re: Find multiple peaks in x,y data
Posted: Wed Feb 21, 2024 4:29 am
by MrProgrammer
Hi, and welcome to the forum.
Greg Holmberg wrote: ↑Wed Feb 21, 2024 3:19 am
You can see three peaks. I want to know the x,y values for each of these peaks, and place them in six cells somewhere.
With the X values in A2:A5000 (sorted ascending) and the Y values in B2:B5000 put
=AND(B2<B3;B3>B4) in
C3 and
fill the formula down the column. Use Data → Filter to show the just the rows with 1 (TRUE) in column C. Copy the six filtered cells from columns A and B to the clipboard. Data → Filter → Remove Filter. Paste the clipboard somewhere. I didn't do any testing because you didn't attach a
spreadsheet.
Greg Holmberg wrote: ↑Wed Feb 21, 2024 3:19 am
I'm running OpenOffice 7.6.4.1 on Ubuntu 23.10 on Intel.
No, you are running
LibreOffice. OpenOffice versions begin with 3 or 4. The
Beginners forum discusses the differences.
If this solved your problem please go to your first post use the Edit ☐ button and add [Solved] to the start of the Subject field. Select the green checkmark icon at the same time.
[Tutorial] Ten concepts that every Calc user should know
Re: Find multiple peaks in x,y data
Posted: Tue Feb 27, 2024 3:14 am
by Greg Holmberg
That's great! I feel embarrassed for not having thought of it. Also embarrassed for confusing the two projects. I knew the difference, and I still confused them!
So, that works as far as it goes. Unfortunately, I need to write further formulas on the result, so I can't have a manual step in the middle (the copy and paste). I need something that produces a 2x3 array of cells for the x,y values of the three peaks.
I was able to do this in Google Sheets with a named function:
Code: Select all
name: FIND_PEAKS
parameters: x, y
Definition:
=REDUCE({0,0}, y, LAMBDA(accum, curr,
    IF(AND(offset(curr, -1, 0)<curr, curr>offset(curr, 1, 0)),
        VSTACK(accum, {INDEX(x, ROW(curr)-ROW(x)+1, 1),curr})
    ,
        accum
    )
))
Unfortunately, these kinds of Lambda functions are not supported in OpenOffice.
Any other ideas? This time I'm attaching a spreadsheet. Look at cell model!B66 where it calls FIND_PEAKS and returns a 2x3 array.
Thanks,
Greg
Re: Find multiple peaks in x,y data
Posted: Tue Feb 27, 2024 6:01 am
by robleyd
Cross posted on
AskLibreOffice.
If you cross post, as a courtesy please let us know that you have done so, otherwise it leads to several discussions and a waste of time because several identical answers may be posted by different users.
Re: Find multiple peaks in x,y data
Posted: Tue Feb 27, 2024 9:09 am
by Hagar Delest
Greg Holmberg wrote: ↑Wed Feb 21, 2024 3:19 am
GNU Octave has findpeaks(), but I don't see anything like this in Calc. Is there something else?
You are comparing 2 different kinds of applications.
A spreadsheet is not able to do such operation directly AFAIK.
I guess you can but with a macro that will do the comparison and store the x,y values each time it finds a peak in an array and then put the values from the array in dedicated cells.
Re: Find multiple peaks in x,y data
Posted: Tue Feb 27, 2024 3:07 pm
by Nick N,
Dear Mr. Holmberg,
Please forgive my ignorance in instrumental engineering.
As long as I remember, by the time I was alumnus. The teacher only taught me how to tune up my old guitar.
See harmonic tuner attached hereto.
Regards
Nick
Re: Find multiple peaks in x,y data
Posted: Tue Feb 27, 2024 5:49 pm
by MrProgrammer
Greg Holmberg wrote: ↑Tue Feb 27, 2024 3:14 am
This time I'm attaching a spreadsheet.
The data subset that you attached has only 30 rows of chart values and doesn't seem to contain any peaks, so it is not very helpful when the topic is about finding the peaks.
Greg Holmberg wrote: ↑Tue Feb 27, 2024 3:14 am
I need something that produces a 2x3 array of cells for the x,y values of the three peaks.
To populate a 3x2 array, use formulas to filter my column C for the value 1 instead of using Data → Filter → Copy → Paste. This attachment has the (X,Y) values for three peaks in E2:F4.
The number of the peaks is the sum of column C. A more complex filter could find all the peaks. Read this tutorial.
[Tutorial] Sorting and Filtering data with formulas
Hagar Delest wrote: ↑Tue Feb 27, 2024 9:09 am
You are comparing 2 different kinds of applications
I would have performed the analysis in
Perl since the program could easily show the (X,Y) values for the peaks. Perl supports complex numbers with Math::Complex. For the chart, the Perl program can create the data for it as CSV, then Calc can import the file with Insert → Sheet From File →
Select file → OK →
Set text import controls → OK → ✓ Link → OK and build the chart with Insert → Chart → XY Scatter. After a new analysis which puts chart data in the
same CSV file that was linked, Edit → Links → Update → Close will refresh the Calc values from the CSV file and update the chart automatically.
If this solved your problem please go to your first post use the Edit ☐ button and add [Solved] to the start of the Subject field. Select the green checkmark icon at the same time.
Re: Find multiple peaks in x,y data
Posted: Wed Feb 28, 2024 3:05 am
by Alex1
This method doesn't necessarily find all peaks, e.g. with 1.58 in B36.
Re: Find multiple peaks in x,y data
Posted: Wed Feb 28, 2024 3:28 am
by Greg Holmberg
Yes, MrProgrammer! That worked! Thank you so much!
Sorry about the few number of rows in the previously attached spreadsheet. I really had to cut it down to make the 128K limit.
For those following along, these are the formulas MrProgrammer used:
Code: Select all
D2 =MATCH(1,$C$2:$C$255,0)
D3 =D2+MATCH(1,OFFSET($C$2,D2,0):$C$255,0)
D4 =D3+MATCH(1,OFFSET($C$2,D3,0):$C$255,0)
I made a slight improvement. I used named ranges.
Code: Select all
H5 =MATCH(TRUE(), isPeak, 0)
H6 =H5 + MATCH(TRUE(), OFFSET(isPeak, H5, 0):OFFSET(isPeak, ROWS(isPeak)-1, 0), 0)
H7 =H6 + MATCH(TRUE(), OFFSET(isPeak, H6, 0):OFFSET(isPeak, ROWS(isPeak)-1, 0), 0)

I5 =INDEX(freq, H5)
J5 =INDEX(db, H5)
etc.
I have attached a spreadsheet:
This one is also truncated, so only has one peak.
Look at sheet 'model', cells H5:J7.
I will reference this post on the ask.libreoffice.org forum.
Thanks again MrProgrammer.
Greg