Hello,
First of all, sorry for the current topic. I'm sure it's a pretty stupid question that calls for a basic answer, but I've been struggling with this issue for a bit and I can't find the answer myself, so I figured I would just ask the great internets for their wisdom.
I would like to do a graph such as the one directly below using my spreadsheet data.
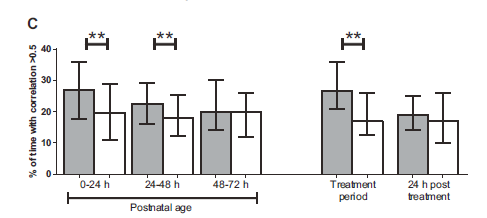
OpenOffice help hints that it is possible but I can't find the right graph type nor how to input the data I want to use. The windows, buttons and options I've got in OpenOffice aren't actually the same as what is told in the help.
I suppose the significance marks are to be added afterwards, as a separate drawing, but it's mainly the standard deviation lines and limits I'm worried about.
Any help please? Thanks in advance.
[Solved] Histogram w/ standard deviation, significance mark
[Solved] Histogram w/ standard deviation, significance mark
Last edited by Orithien on Thu Mar 19, 2020 3:52 pm, edited 1 time in total.
OpenOffice 4.1.6 on Windows 10
- MrProgrammer
- Moderator
- Posts: 4907
- Joined: Fri Jun 04, 2010 7:57 pm
- Location: Wisconsin, USA
Re: Histogram with standard deviation and significance mark
Hi, and welcome to the forum.
I am not familiar with the markings shaped like an H with two stars above. Perhaps you can't create that with a Calc chart. Take a look in Chapter 3.
For questions like this, it is helpful to attach a document demonstrating the situation (remove confidential information then use Post Reply, not Quick Reply, and don't attach a picture instead of the document itself).
If this solved your problem please go to your first post use the Edit button and add [Solved] to the start of the title. You can select the green checkmark icon at the same time.
[Tutorial] Ten concepts that every Calc user should know
I believe one Calc feature you want is "Error Bars". Read about this in Help → Index or in User Guides (PDF) or searching for topics about it in the Calc Forum. There are plenty of topics about that. You may have more success with a search if you use Calc's term "chart" instead of "graph". Definitely read Calc user guide Chapter 3 - Using Charts and Graphs.Orithien wrote:I would like to do a graph such as the one directly below using my spreadsheet data.
I am not familiar with the markings shaped like an H with two stars above. Perhaps you can't create that with a Calc chart. Take a look in Chapter 3.
For questions like this, it is helpful to attach a document demonstrating the situation (remove confidential information then use Post Reply, not Quick Reply, and don't attach a picture instead of the document itself).
If this solved your problem please go to your first post use the Edit button and add [Solved] to the start of the title. You can select the green checkmark icon at the same time.
[Tutorial] Ten concepts that every Calc user should know
Mr. Programmer
AOO 4.1.7 Build 9800, MacOS 13.6.3, iMac Intel. The locale for any menus or Calc formulas in my posts is English (USA).
Re: Histogram with standard deviation and significance mark
No, what you want to do is not at all easy in a spreadsheet graph and you cannot do what you want in a spread sheet without a lot of trouble if at all.I'm sure it's a pretty stupid question that calls for a basic answer
See https://www.youtube.com/watch?v=suFPnBV_NU4 for a description of how to create a histogram. I do not see any obvious way to get the error bars for the individual histogram bars. I have never seen a way to get individual standard errors or standard deviations for each bar of the plot.
How close a match to the exact example do you need? Your example looks awfully old fashioned, as if is is hand drawn. If you just need to present data in an equivalent format, then that is not too hard, my first thought is to suggest using a real graphing program. Something like R or Gnuplot is the type of tool you need.
The closer you need to approximate the exact formatting of the sample chart, the more difficult or, at least, time-consuming it becomes.
Can you upload a spreadsheet with some sample data? There is an upload tab at the bottom of the Reply and Quote windows.
LibreOffice 7.3.7. 2; Ubuntu 22.04
Re: Histogram with standard deviation and significance mark
Thank you for your replies!
Being stuck at home has its advantages: I finally have been able to work on this again.
I've found how to do it: the first step is to actually create the histogram with one single series of values. It's actually easier to create a simple histogram (not the one with the pre-made error bars, but the plain simple one) with one single set of values.
Then by right-clicking on the chart and choose "edit", I was able to modify its individual parameters (like the Y axis values etc) with a right-click on each of them. By right-clicking on the histogram bars, a contextual menu appears which has the Y-error bars option in it. The error bars windows then allowed me to select a second set of values for my actual error bar values.
The significance marks (the two stars) have to be manually placed over the chart using the drawing tools.
OpenOffice 4.1.6 on Windows 10